Here at DaVinci Education, what we affectionately call the CI Season runs at least from July through September, encompassing both our initial outreach offers to provide support and the two months that the CI submission portal is open. In other words, our team knows that the Curriculum Inventory is a big deal. That is why we are excited to share with you some tips on how to utilize our Insights Dashboard to help you get CI ready, any time.
The Curriculum Inventory Report & Accreditation
In case you aren’t familiar with what the Curriculum Inventory report is, or what it is used for, the American Association of Medical Colleges describes the CI as “the premier benchmarking and reporting tool on content, structure, delivery, and assessment of U.S. and Canadian medical school curricula for both M.D. and D.O. degree-granting accredited schools.” Sharing information about curricula at a given institution helps inform national reports on curricular structure across the US and Canada, as well as provides a historical perspective on change over time. These national reports on various topics can then be utilized “to facilitate continuous quality improvement, facilitate discussion among curriculum committees and teaching faculty, support schools’ accreditation monitoring, enhance medical education research, and inform legislators and the general public.” While the CI is a useful tool for tracking patterns in medical education across the US, there are also multiple ways that institutions can utilize the data collected to inform program evaluation and innovation by providing a benchmark of what content is being taught, in which format and how it is assessed. Importantly, CI data can also support accreditation preparation and reporting by providing insight into the Liaison Committee on Medical Education (LCME) Data Collection Instrument (DCI). We hope to also see references for the Commission on Osteopathic College Accreditation (COCA) instruments integrated into the CI report in the near future.
Over the past few years, the AAMC has made a concerted effort to align the CI report with the LCME DCI through the modification of certain CI tables, as well as the addition of contextual information and hyperlinks to specific DCI tables. While all of this is important, it can still take significant resources to prepare and review your CI report, especially in August and September, just as a new academic year is kicking off for many preclinical cohorts. The Insights Dashboard helps by quickly highlighting mapping gaps and potential areas of concern, as well as pointing out what you are doing correctly. This data can provide a sense of security - you know what is happening in the curriculum, can quickly correct any mistakes or oversights to stay CI (and thus one step closer to accreditation) ready. And you don’t have to wait for CI season to do it, reducing the burden on resources by spreading the necessary work across the academic year.
Utilizing Leo’s Insights Dashboard for CI Prep
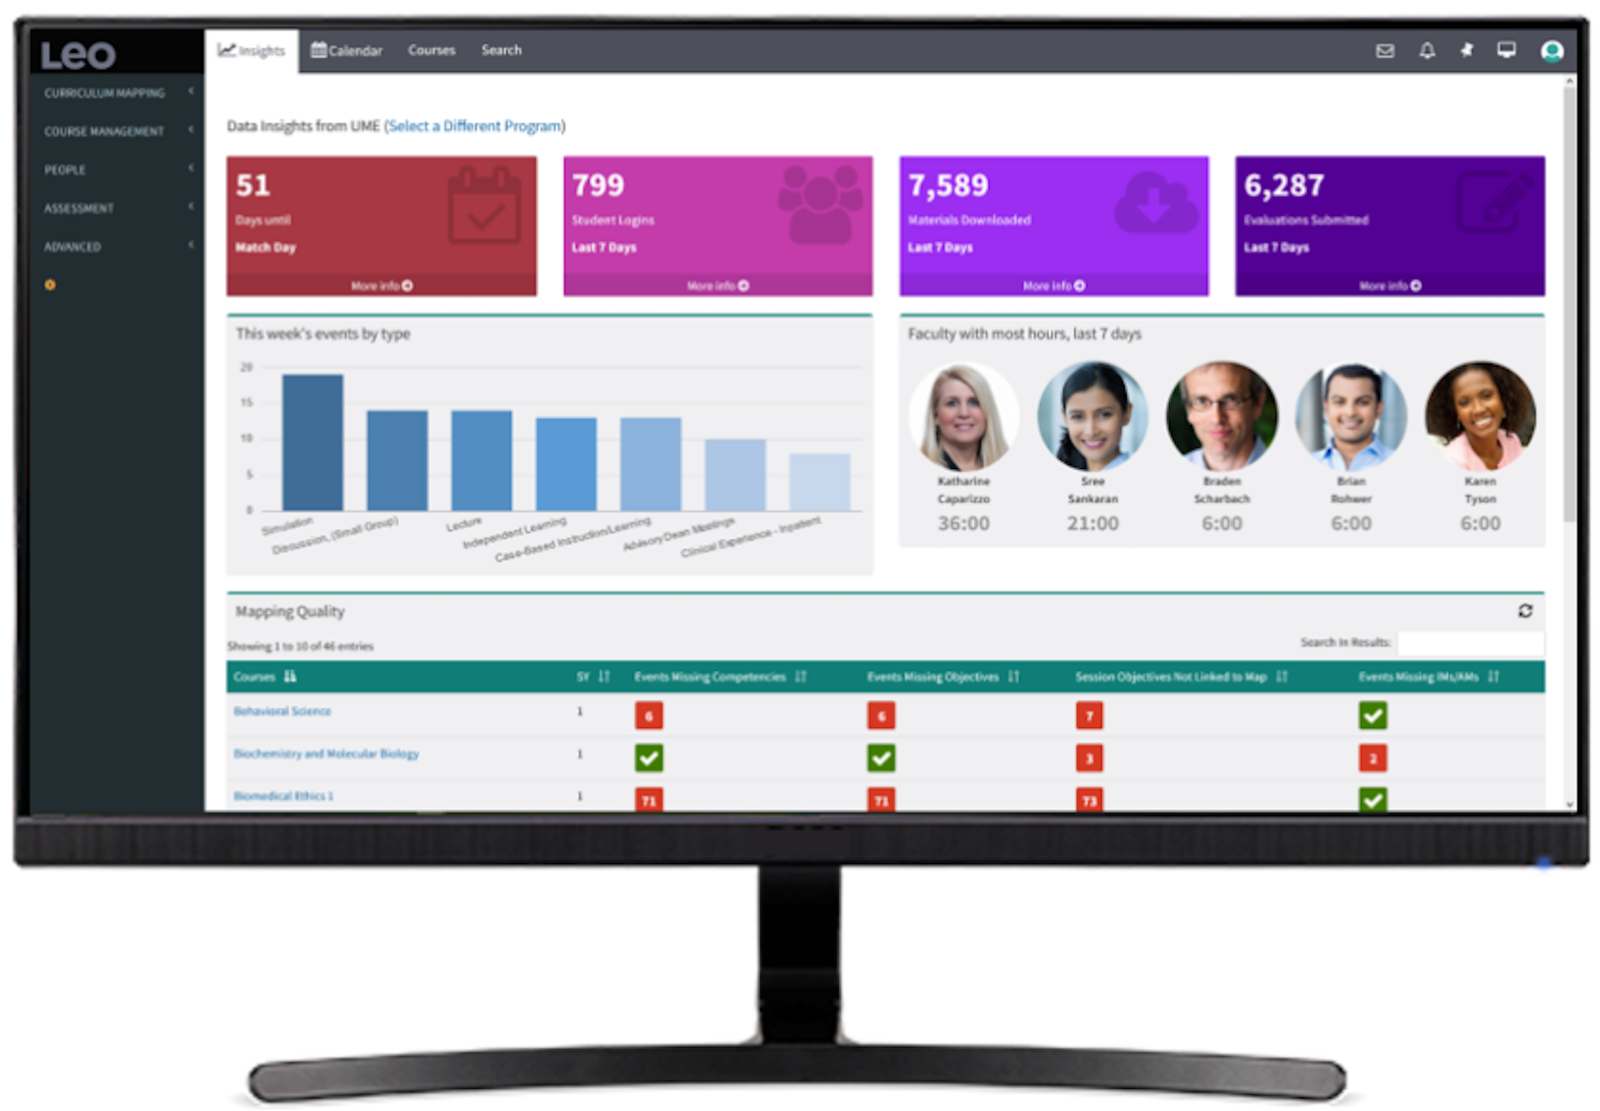
The Insights Dashboard pulls mapping data from all primary courses (i.e. the courses you report on to the CI, otherwise known as Sequence Blocks) into one easily accessible table, providing an overview of your curricula as well as methods for acting on that information. Green checkmarks display when each element of ideal mapping is met for events within each primary course. The ideal event mapping standards that determine green checkmarks in the dashboard are based on the mapping structures that the CI requires, for example Instructional and Assessment Methods.
With a glance at the Insights Dashboard’s Mapping Quality report, you can quickly identify which of your events are missing instructional and/or assessment methodologies (IM/AM), which are required for CI submission under the CI business rules. If you already have Event Types mapped to default IM/AMs, which automatically populate IM/AMs when an event is created in Leo, the Events Missing IMs/AMs column should be green. If there are red boxes in this column, they can be quickly fixed by reviewing your Event Types to ensure default IM and/or AMs are set, or by manually tagging the Event with an IM or AM. Since the CI requires that an event have at least one IM or AM as the primary methodology, the box will only turn red if both are missing. If an event is mapped to an IM (ex. Lecture), then the box will display the green checkmark, even if no AM is linked to that event. You can also still have more than one IM or AM in an event, including a designated primary. As long as at least one IM or AM is tagged for that event then the green checkmark will display. This information will then populate Tables 1-6 of the CI report, as well as help inform the LCME DCI tables 6.0-6.3 (Pre-clerkship & Clerkship Instructional Formats; Self-Directed & Life-Long Learning), 6.6 (Service-Learning/Community Service) and 9.0-9.2 (Methods of Assessment - Pre-clerkship & Clerkship).
In an ideal event, all session objectives are linked to (course or program) objectives, which in turn link to competencies - thus providing a hierarchical structure to mapping, from the most detailed level to the overarching components needed for accreditation. Therefore, the Insights Dashboard will only turn green when all session objectives in an event are linked to an objective. This makes it easy to identify and rectify potential gaps that could cause issues for accreditation. For example, under the Unlinked SO column, if one session objective remains unlinked due to an accidental oversight - we are all human after all and humans make mistakes - the box will stay red until that wayward SO is linked. You can do this by clicking the Course name which brings you to a list of all events in that course, then going directly to the place where that mistake can be fixed (i.e. the event). This visual way of quickly tracking mapping across courses and cohorts provides an efficient method for program review, rather than having to dig through multiple reports or spreadsheets. We all know how long that CI report can be to review with a fine-tooth comb!
We also know that not every event might have or need session objectives - so if there aren’t any SOs in an event, then the dashboard will not indicate that there is an issue with that event.The box will only turn red when an SO is present in the event and not linked to a higher level objective. For example, if you have mapped a course or program objective directly to the event then you don’t necessarily need to also add a more detailed session objective because the other objective already serves the role of proving the purpose for that event existing in your curricula. Therefore, a green checkbox will still populate under the Unlinked SO column, even if you don’t have a particular session objective for that event. This allows flexibility for your institution - if session objectives are part of your map then we give you a way to track and fix potential gaps. However, if you tend to map higher level objectives and don’t worry so much about event level details (for example for clinical experiences), then the dashboard will also celebrate that rather than try to force you to utilize a mapping element that doesn’t work for your institution.
Just like with the CI, don’t panic if you see a big number in red. There can be a large number listed under the Events Missing Competencies column of the dashboard for a particular course, but it might just be due to an oversight in linking a couple of competencies to objectives. By finding and fixing the gap where a competency is not linked to an objective, Leo will update every event and course where that relationship needs to be indicated. Voila! The numbers will drastically decrease into something much more manageable as the system updates that change for you across every course and event where the gap previously existed. Utilizing the other mapping reports in Leo to help identify and quickly fix these gaps enhances the usefulness of the Insights Dashboard.
If there is mapping missing across multiple rotations (i.e. sections) of a course, fixing the identified issues in one section and rolling that section over via Leo’s Course Rollover tool will then apply your most recent changes to other existing sections. In this way, you can pinpoint and fix exactly what the issue was by using the data from the Insights Dashboard. You can also quickly identify which section of a course you want to use in the CI report and just focus on turning the entire row for that course section into green checkboxes, without worrying about the other sections for mapping purposes. However, if you do choose to address and apply fixes for each section, this can visually highlight for accreditation that the educational experience is equitable across all sections of a course. Showing that students receive the same materials and activities in all locations, whether various campuses or clinical sites.
These are just a few of the ways that the data displayed in the Mapping Quality report can be utilized for providing insight into your program and actionable ways to improve your mapping, prepare for the Curriculum Inventory report, as well as spot and fix potential concerns for accreditation at any time.
How will you utilize the Mapping Quality report and the Insights Dashboard?